Visualise IoT data with Grafana dashboards
Considering the huge amount and variety of data collected by IoT devices, it is important to choose the right environment to store and manage it. One option is Grafana, an open-source platform with tools for data analytics, extracting metrics, monitoring through easy-to-read, multifunctional dashboards, and triggering alert notifications for various kinds of event. Here, we’ll show you a few basic applications of Grafana using our products in real-world applications.
Introduction
Considering the huge amount and variety of data collected by IoT devices, it is important to choose the right environment to store and manage it. One option is Grafana, an open-source platform with tools for data analytics, extracting metrics, monitoring through easy-to-read, multifunctional dashboards, and triggering alert notifications for various kinds of event. Here, we’ll show you a few basic applications of Grafana using our products in real-world applications.
IoT data types
To begin with, let’s overview the types of data collected by IoT devices. There are three main kinds:
- equipment data, such as real-time detection of faults or system anomalies such as flooding or pressure drops,
- environmental data, such as temperature, air quality, presence of people,
- submeter data, such as from water and power meters.
Grafana — data presentation in practice
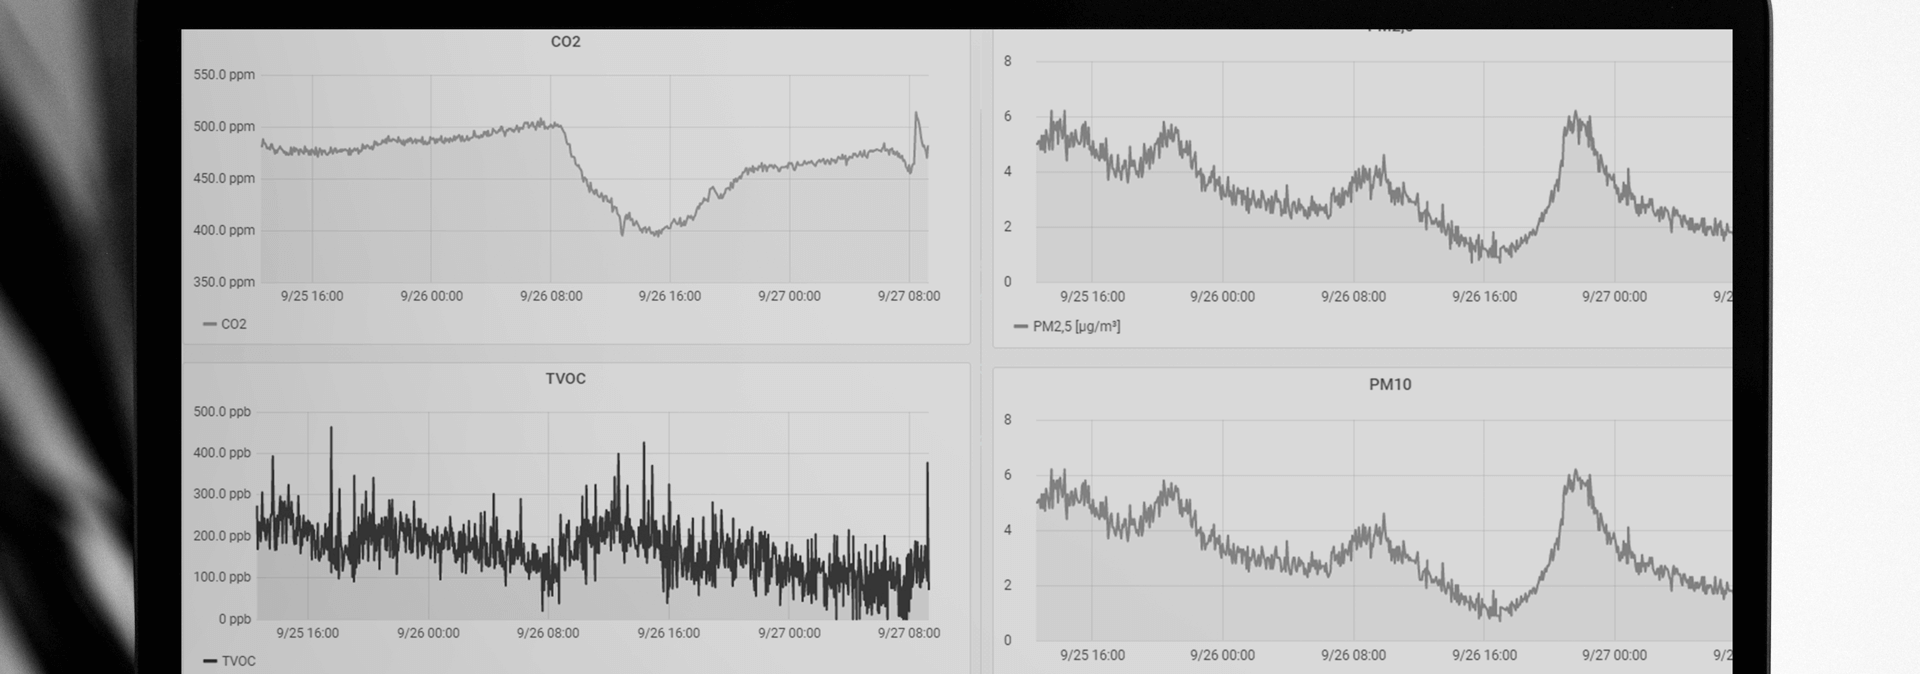
Grafana allows us to gather related data into one place. For example, our YO Pure Pro device is used to collect a range of environmental measurements (figure 1).
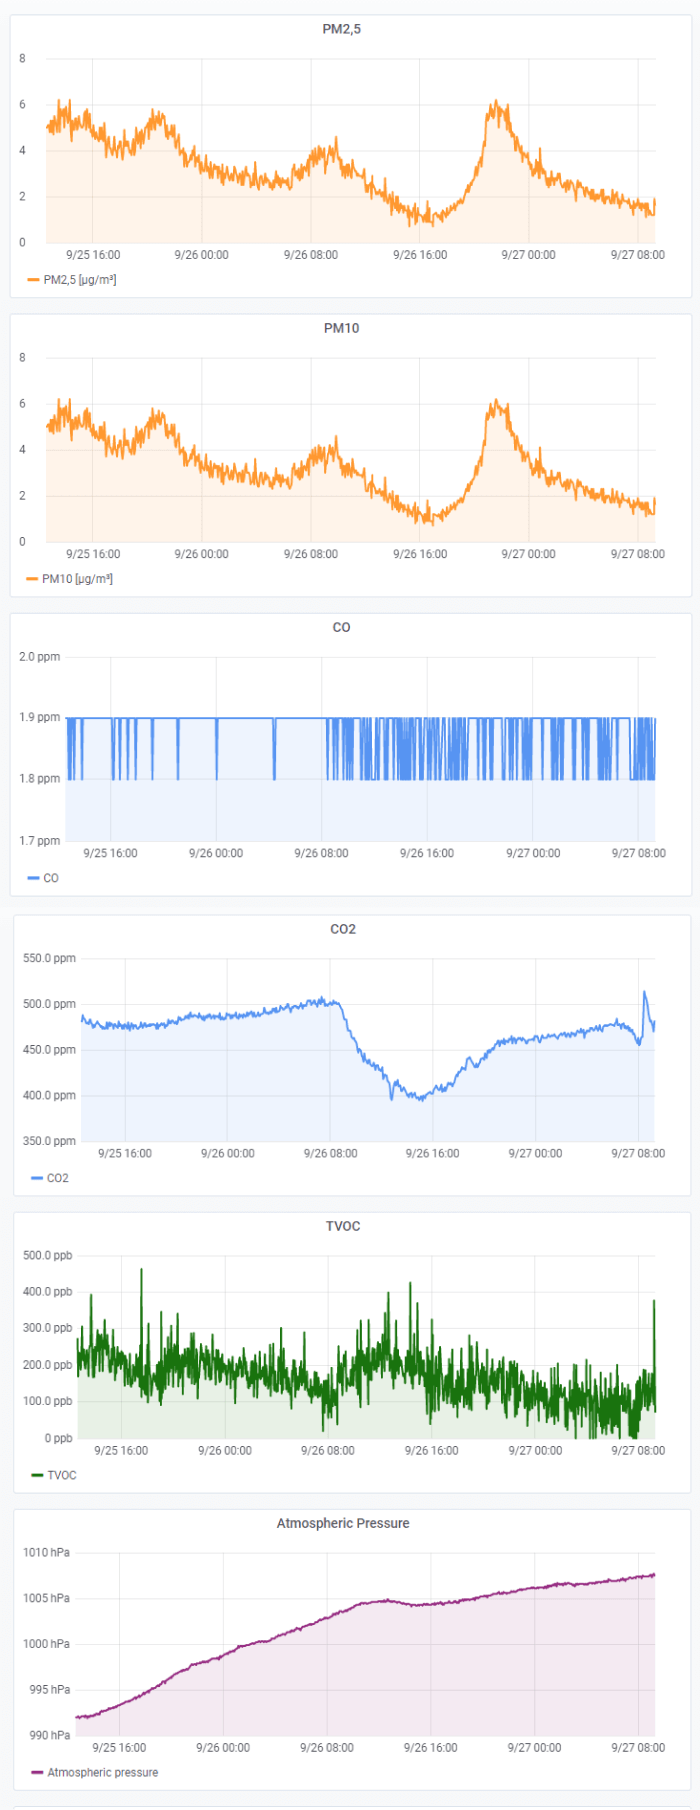
By using a set of dashboards, the telemetric data streams from a particular device can be organised into rows and columns. We can assign colours, units, titles, and filters for clarity. The data in figure 1 is presented in the time domain, commonly used to explore trends and to locate problems.
Detecting pressure anomalies
The YO Refrigerant Monitor is used to track the operation of a refrigeration system via its internal pressure values.
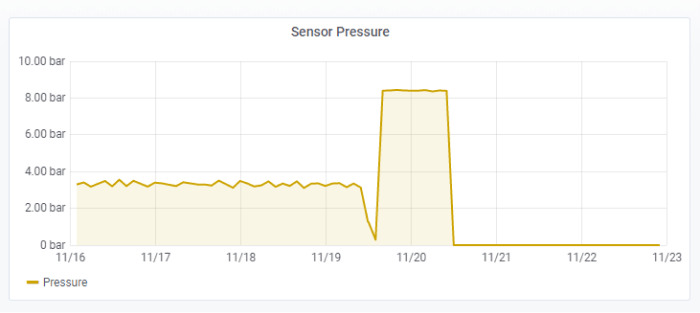
From the dashboard in figure 2, we can see that the refrigerant pressure is normally around 3.5 bar. Just after noon on 19 November, the pressure steeply increased to over 8 bar, followed by a sudden drop to zero. On that basis, we can deduce a fault that needs immediate attention. Prompt detection allows immediate response from the maintenance department to reduce the costs associated with the breakdown. This is just one of the many benefits of using such a system.
Differential pressure and HVAC filter
Monitoring is also useful for addressing maintenance-related parameters such as the condition of a filter in a HVAC system. The measurement by which we can assess the filter is the pressure difference between its inlet and outlet. As a filter becomes clogged, its resistance to airflow increases, leading to an increase in the differential pressure across the filter. Grafana lets us observe the trend in this differential pressure over the long term — a useful and practical application of the YO Airflow Pro device.
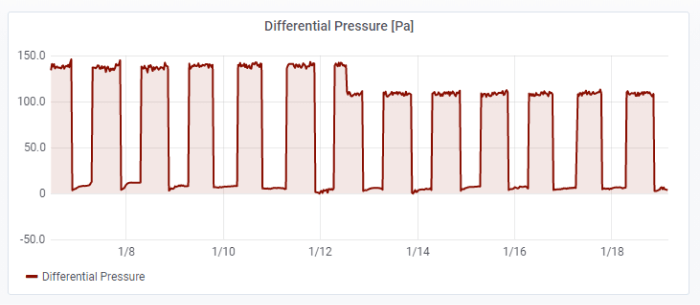
In figure 3, you can see the exact day when the filter was replaced. This took place on 12 January, when the differential pressure dropped from ~140 Pa to ~110 Pa. This kind of long-term system monitoring gives us a better understanding of the specific system, allowing benefits such as tracking filter life, and predicting when the filter will need replacement, and reduces the need to manually inspect the filter to ascertain its condition.
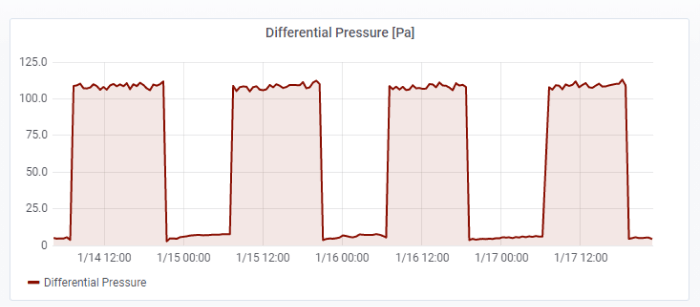
Same signal, different benefits
The differential pressure across the filter can also be used to track system cycling. In figure 4, you can see when the HVAC system switches on and off. We can precisely check the date and time of any given event in Grafana so, based on the differential pressure, we can verify that the HVAC system is working correctly. We can see that this system cycles on at 7am, and off at 9pm. Changing our dashboard view in Grafana puts this one signal to multiple diagnostic purposes.
Alerts — stay informed
Another example of Grafana’s usefulness is the ability to set telemetry-triggered alerts. Custom conditions can be configured to trigger an alert and automatically notify the responsible person. Automatic notifications significantly increase response effectiveness, especially in critical systems. A great example is flood detection. Telemetry data is gathered by the YO H2O device, which immediately sends a signal when a flood is detected. Figure 5 shows the data for the week when a flood was detected.
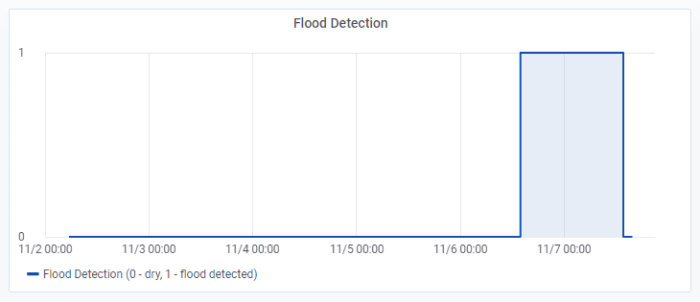
The flood signal has two states — ‘0’ means that the device is in a dry environment, and ‘1’ means that the device has been flooded. The dashboard presents the data very clearly presented, with a description of the signal. The appropriate person was thus informed and the fault was eliminated. The system could be extended with a smart valve which uses digital signal to automatically open or close water inlet. In this configuration, no human presence will be required to stop the flow — YO H2O will send information directly to the actuator, which will close the water inlet valve.
Data presentation for user-friendly analysis
You can also use Grafana to group multiple data streams into one dashboard for easier data analysis. Such an example would be the monitoring of three-phase current using current transducers (CTs) connected to a YO Power device.
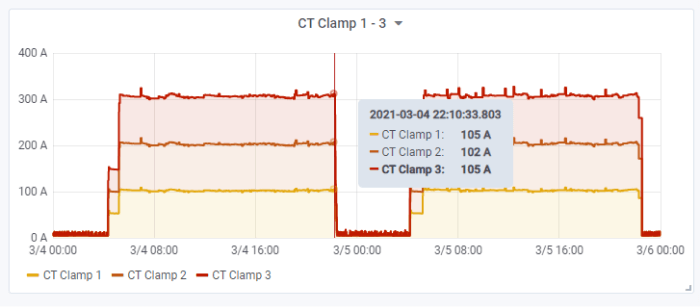
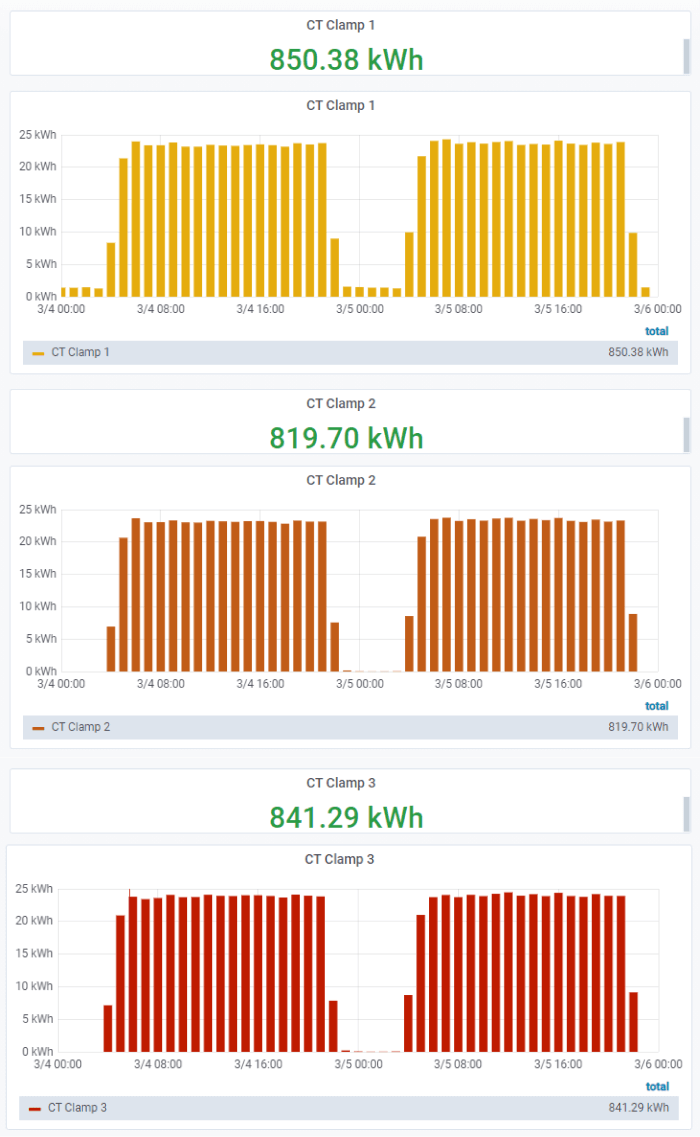
By looking at the chart in figure 6, we can easily obtain information about the malfunctions of e.g. an electric motor (detecting abnormal operating states), or to measure power consumption (by integrating current over time). Grafana’s functionality includes queries and various mathematical functions. Using the current-over-time integral, for instance, we can calculate the total power consumption (figure 7).
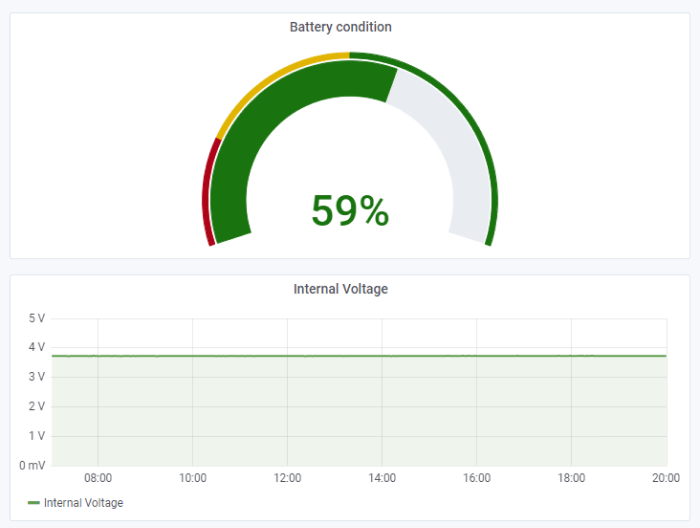
Battery status diagram
The devices in an IoT network are designed to monitor a variety of data, and they’re often located in places with difficult access. We’re not always able to power a node from the mains supply, so devices are usually battery-powered. It is therefore important to monitor the current battery status. Once again, Grafana comes to the rescue, allowing us to calculate a device’s battery level. Based on the manufacturer’s datasheets for the battery, we can determine and visualise its current condition or track its voltage level (figure 8). Our devices are designed to maximise battery life — our range includes a number of battery-powered devices such as YO H2O, YO Airflow Pro, YO Refrigerant Monitor, and many more. You can read more about battery life on our blog.
Conclusion
Presenting data through a dashboard, filtering it, and creating alerts and queries are just a fraction of the possibilities that Grafana offers. This open-source solution allows us to build a proper front end for any application we need — all it takes is your data and your creativity.